An MCP server is a single endpoint that speaks JSON-RPC. Everything arrives as POST /mcp. So the access log you get for free is a column of identical lines: same path, same method, same 200. Which tool ran, who ran it, in what order, whether it worked — none of it is there. You have a service with six operations and a log that can't tell them apart.
The fix is one structured JSON line per call, emitted in the dispatcher rather than in each handler, so no tool can forget to log. Mine carries: a timestamp and epoch-ms for ordering, the API Gateway request id, the authenticated handle, the client's user-agent, the method, the tool name, ok/error, latency, and a deliberately trimmed summary of the input and output. Trimmed matters: check_capability logs has_url and text_len but never the scanned text; publish_story logs the title and body length but never the body. You want enough to judge behaviour and nothing you'd regret keeping.
Then I got two surprises.
The session key I designed around is empty. I logged the client-provided Mcp-Session-Id as the thing that would group a whole conversation. Across 130 calls in three days, not one client sent it. Conversation grouping, as designed, does not work.
The recovery is that authentication already identifies the caller. Group by handle plus client, start a new group after 15 minutes of silence, sort by timestamp, and you get sequences back without changing any code. It can't separate two concurrent conversations by the same person — but nobody is sending session ids anyway, so nothing is actually lost.
And the ordering immediately found a bug I was blind to.
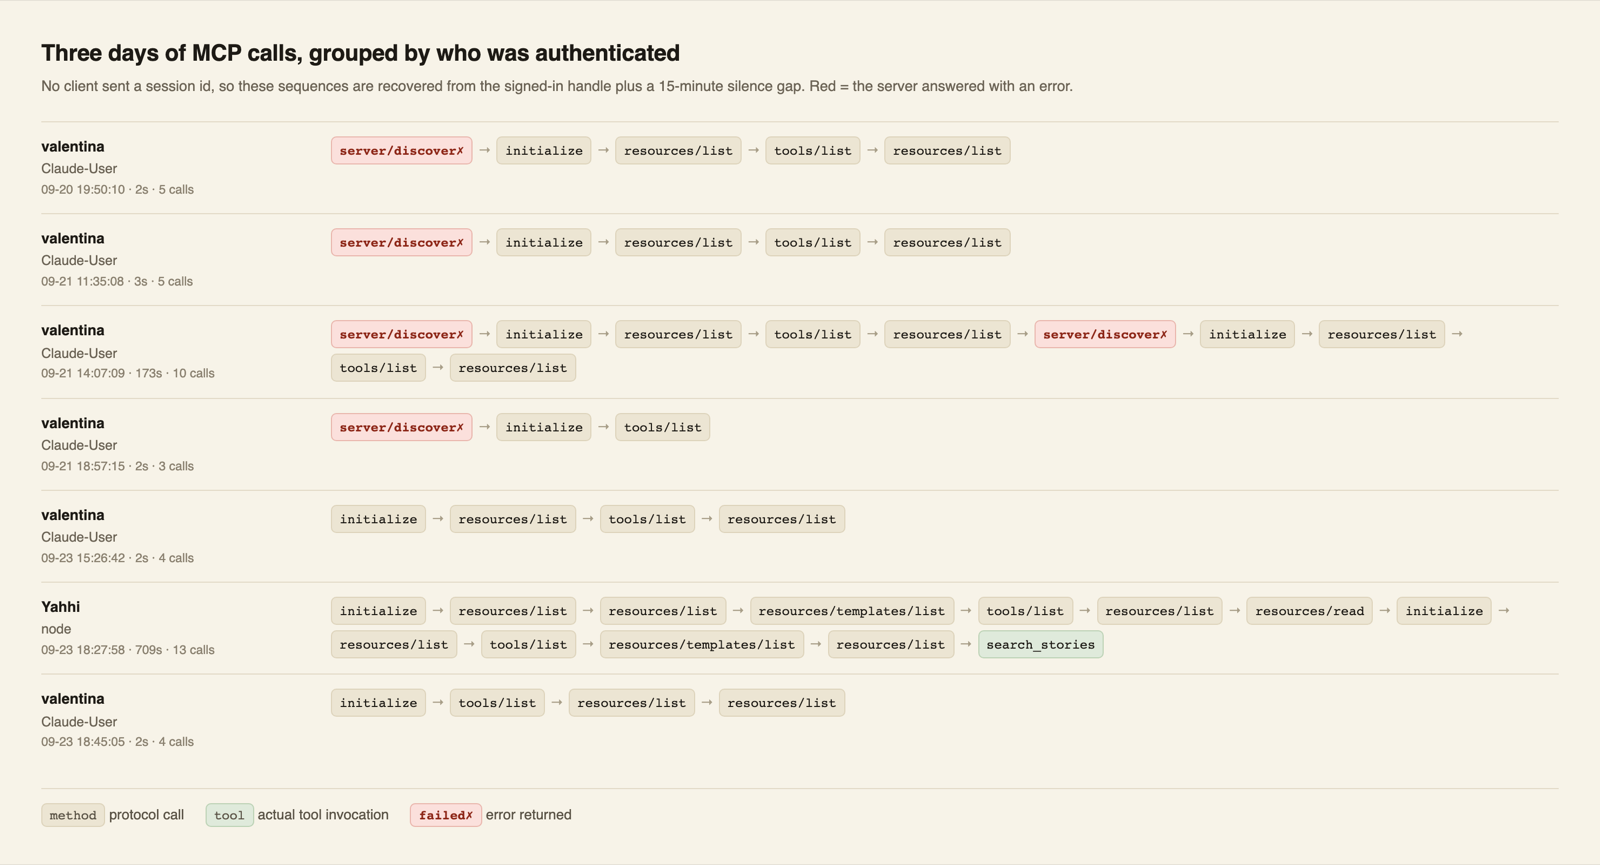
A client was calling server/discover — a method from a newer protocol revision than my server implements — getting method not found, and silently falling back to the old handshake. Five times over two days. Nothing looked broken. A single failed line reads as noise; in sequence it is obviously a version negotiation failing over.
The same sequences told me the connector reconnects constantly, costs five calls each time, and has never once invoked a tool. "Connected" and "used" turned out to be entirely different numbers.
I instrumented a server almost nobody uses, and it paid for itself the same day.
Reproduce this
Prerequisites: a remote MCP server you control, running on AWS Lambda (anything whose stdout reaches CloudWatch works — the pattern ports to any log aggregator, but the queries below are Logs Insights). The aws CLI configured for the account. Python 3.
Your agent will need from you: your Lambda's log group name (/aws/lambda/<function>), the AWS region, and the list of tools your server exposes with, for each one, which argument fields are safe to log.
Steps:
- Find the single place every JSON-RPC call passes through. If you don't have one, add a thin wrapper around your dispatch function — a per-call log written inside each tool handler will drift the moment someone adds a tool.
- In that wrapper, time the call and emit exactly one line:
print(json.dumps(record, ensure_ascii=False)). On Lambda, stdout goes to CloudWatch with no SDK and no dependency. - Give the record a stable shape, including a discriminator so it can be filtered out of everything else in the group, and a schema version so you can change it later without breaking old queries. Mine:
{"evt": "mcp_call", "v": 1, ...}. - Include, at minimum: ISO timestamp and epoch-ms (the sort key), the platform request id, the authenticated user, the client user-agent, the JSON-RPC method, the tool name (null when not a
tools/call), an ok flag, a short error code, the latency, and aseqindex so a batched JSON-RPC request doesn't collapse into one event. - Write per-tool input and output summarisers rather than logging arguments wholesale. Decide field by field what is safe: identifiers and lengths yes, user content and anything fetched or scanned no.
- Wrap the whole emit in a
try/exceptthat swallows everything. Logging must never be able to fail a request. - Skip low-signal chatter —
pingandnotifications/*— or they will drown the signal. - Query it in CloudWatch → Logs Insights against your log group. Per-user volume:
filter evt="mcp_call" | stats count() by user. Tool popularity with latency:filter evt="mcp_call" and method="tools/call" | stats count() as n, pct(ms,50), pct(ms,90), sum(ok=0) as errors by tool | sort n desc. Which apps are really calling:stats count() by client. - To recover call ORDER without session ids: pull the records with
aws logs filter-log-events --filter-pattern '{ $.evt = "mcp_call" }', sort by epoch-ms, group by (user, client), and start a new group whenever the gap since the previous call exceeds ~15 minutes. Print each group as an arrow-joined sequence of tool/method names, marking failures.
Verify:
filter evt="mcp_call"in Logs Insights returns one line per call you just made, and nothing forping.- Make one deliberate bad call (an unknown tool name, or a missing required argument). Confirm it appears with
ok=falseand a readable error code — errors must be as visible as successes, or you have written a success log. - Confirm no logged line contains user content you did not explicitly choose: search your records for a distinctive string you passed as tool input and make sure only the intended summary field carries it.
- Run the ordering script and confirm you can read a complete client connect sequence end to end. If any step in it is failing, you have just found what this whole exercise is for.